


Yields on 10-to-13-year government bonds rose by as much as 45 basis points week-on-week, even as shorter-dated maturities held broadly steady
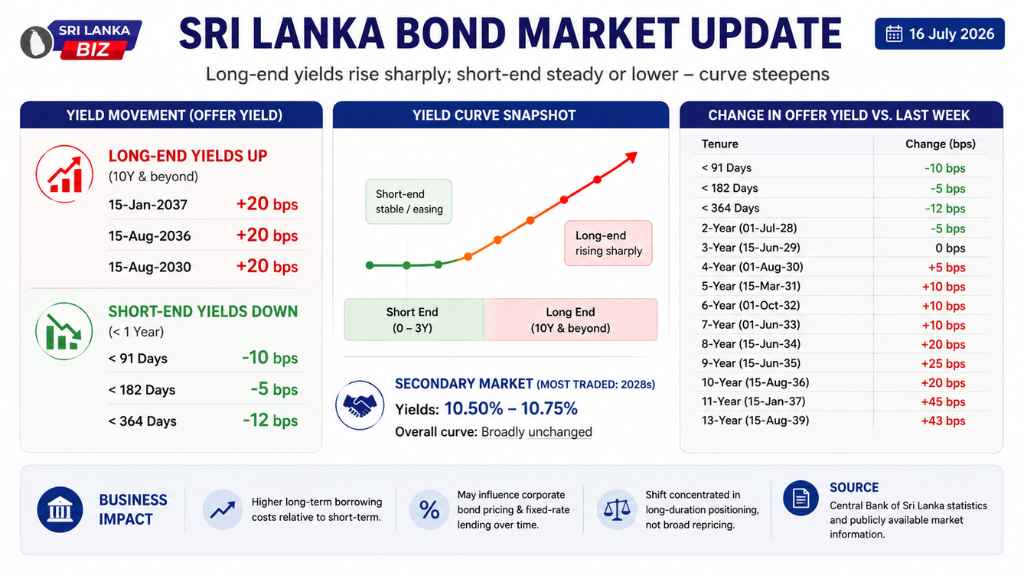
Yields on longer-dated Sri Lanka government bonds rose sharply over the past week, with the steepest increases concentrated in maturities of 10 years and beyond, even as shorter-tenor bonds saw yields hold steady or ease slightly.
The 15-Jan-2037 maturity saw its offer yield climb 20 basis points week-on-week, while the 15-Aug-2036 maturity also rose 20 basis points. The move was more pronounced further out on the curve: the 15-Jan-2037 bond’s bid yield rose 45 basis points, and the 15-Aug-2039 maturity rose 43 basis points on a bid basis. In contrast, yields at the shorter end of the curve moved in the opposite direction, with tenors under one year easing between 5 and 12 basis points, and the 2-year and 3-year segments little changed.
The divergence marks a steepening of the yield curve, where the gap between short- and long-term borrowing costs widens. This contrasts with conditions in the actively traded secondary market segment, where 2028 maturities — the most heavily traded bracket during the period — changed hands at yields of 10.50% to 10.75%, with the overall secondary market yield curve described as broadly unchanged over the period. The sharper long-end moves observed in bid/offer levels have yet to fully filter through to realized secondary market trading in shorter maturities.
The 15-Aug-2030 maturity also registered a 20 basis point rise, positioning the middle of the curve as a transition point between a relatively stable short end and a more volatile long end.
No policy trigger or official commentary explaining the long-end move has been published by the Central Bank of Sri Lanka. Curve steepening of this kind can reflect a range of factors, including changing expectations for long-term inflation, fiscal financing needs, or investor demand patterns for specific tenors, and should be read as a market pricing signal rather than a definitive indicator of future monetary policy direction.
Key Numbers
| Tenure | Change vs. Last Week |
|---|---|
| < 91 Days | -10 bps |
| < 182 Days | -5 bps |
| < 364 Days | -12 bps |
| 2-Year (01-Jul-28) | -5 bps |
| 3-Year (15-Jun-29) | 0 bps |
| 4-Year (01-Aug-30) | +5 bps |
| 5-Year (15-Mar-31) | +10 bps |
| 6-Year (01-Oct-32) | +10 bps |
| 7-Year (01-Jun-33) | +10 bps |
| 8-Year (15-Jun-34) | +20 bps |
| 9-Year (15-Jun-35) | +25 bps |
| 10-Year (15-Aug-36) | +20 bps |
| 11-Year (15-Jan-37) | +45 bps |
| 13-Year (15-Aug-39) | +43 bps |
Business Impact
A steepening yield curve, where long-term borrowing costs rise relative to short-term rates, typically signals that investors are demanding higher compensation for holding long-dated government debt. For businesses and financial institutions, this can translate into higher long-term funding costs relative to short-term borrowing, and may influence corporate bond pricing and fixed-rate lending over time. For fixed income investors, it also changes the relative attractiveness of different points on the curve. The contrast with a broadly stable short-to-medium-term secondary market suggests the shift is currently concentrated in long-duration positioning rather than reflecting a broad repricing of near-term borrowing costs.
Source Attribution
Source: Central Bank of Sri Lanka statistics and publicly available market information.